 Jaro
Hero
0/7The first screen. It's judged at a glance, so it must say what this is, who it's for and why it matters before anyone reads on, and cost the visitor nothing.
Put a short tag above the headline
- Pick one kind below, 2 to 5 words.
- Set it smaller than the headline.
For product teamsWebsite as a serviceTrusted by 2,400+ teamsWhy?A label tells people at a glance they're in the right place.
Pick one headline strategy and keep it short
- Pick a strategy (tabs below).
- Aim for about 10 words, in customers' words.
- Run a 5-second test with 5 people.
When buyers know the problem and want it gone: the result they get, and the pain they no longer have.
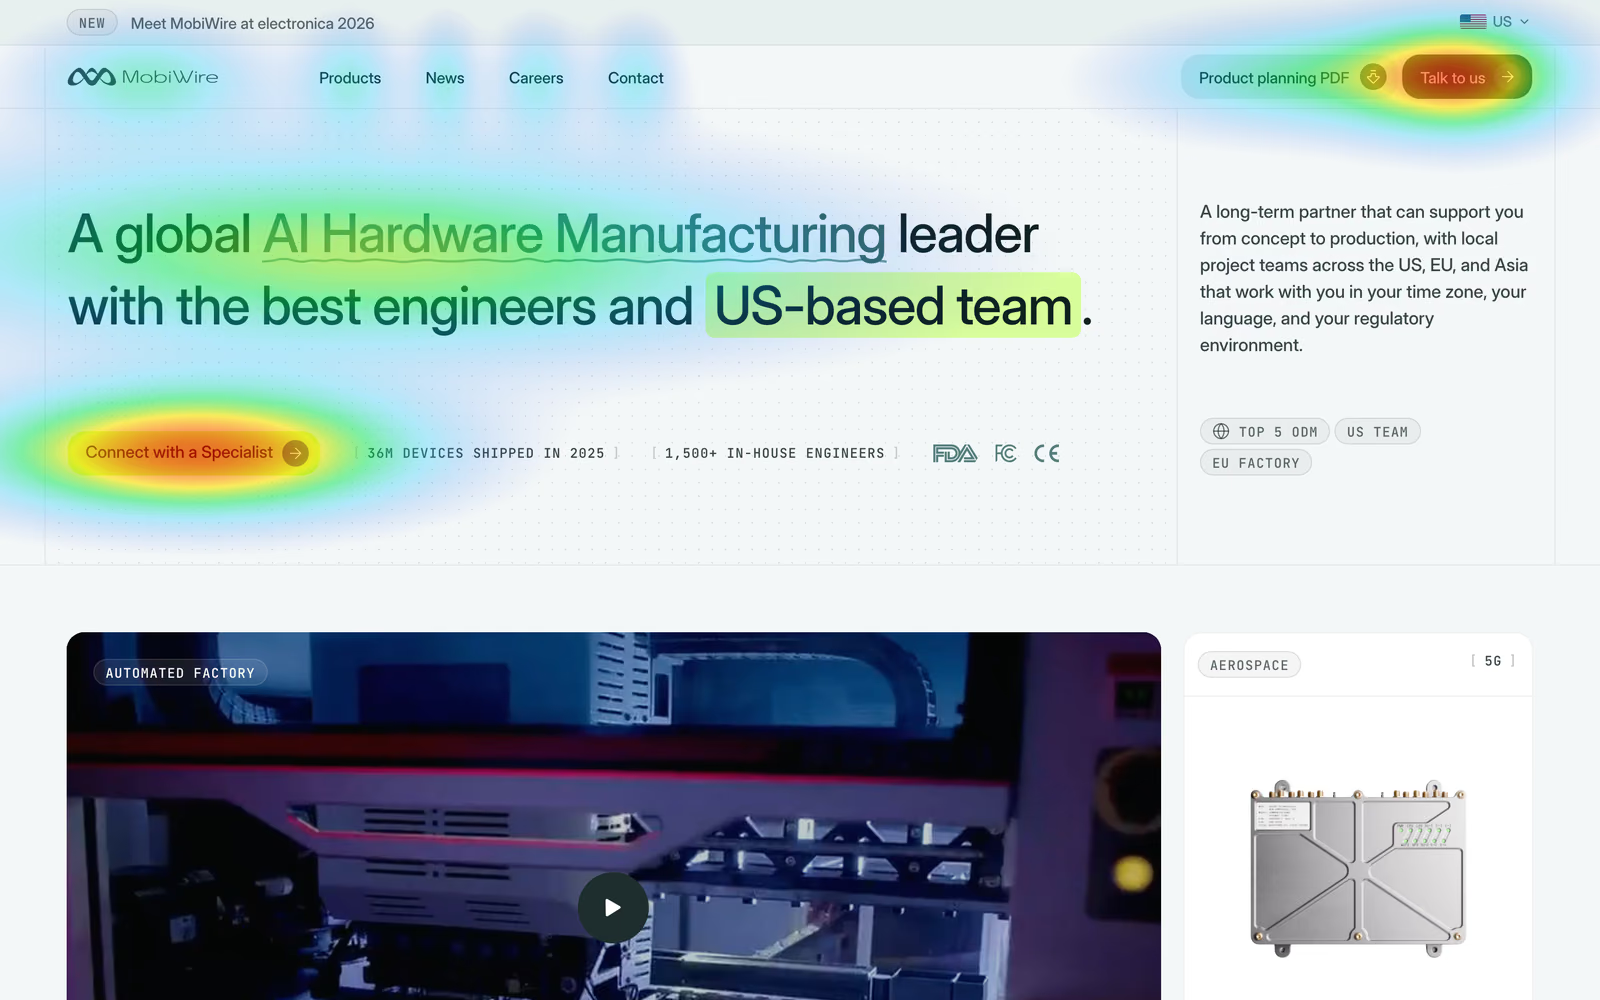
{Outcome} without {pain}The all-in-one platform for modern teamsClose your books in 2 days, not 2 weeksWhen buyers compare vendors in a category they already know: what makes you the one to pick, with proof they can check. MobiWire, in the screenshot, leads with its category and position.
{Category} {leader/specialist} with {what only you have}A global Hardware Manufacturing leader with the best engineers and US-based team.Why?You have a few seconds to make the value clear before people leave.
Back the headline with one line under it
- Pick a strategy (tabs below).
- Keep it to one short line, right under the headline.
- Aim for grade 7 in Hemingway Editor.
When the headline is a claim or a USP: say what it is and for whom.
{Category} for {persona} in {niche}ODM and JDM partner for US hardware brands, from concept to production.When the headline is an outcome: say how you get there, so it doesn't sound too good to be true.
{Product} {does what} so you {result}We sync your bank and ledger every night, so month-end is a review, not a rebuild.When the claim needs backing more than explaining: put the strongest number under it.
{Number} {who} already {result}2,400 finance teams closed their books in 2 days last month.Why?Plain copy converts about twice as well as professional-level copy.
Match the headline to the ad or search people came from
- List your top ads and searches.
- Reuse their words in the headline or tag.
- Give a big campaign its own landing page.
Close your books in 2 daysClose your books in 2 days, not 2 weeksWhy?Google Ads scores landing pages on relevance to the ad, and so do visitors.
One primary button on the first screen
- Put it under the subheadline, in the nav's wording.
- Add a lighter second action beside it.
- Say what happens next under it.
- Complex or expensive offer: explain it before the button.
[Action verb] + [outcome or free qualifier]: Book a 15-minute demo[Low-commitment verb] + [what they'll see]: See how it works (2 min)Why?57% of viewing time is spent on the first screen.
Put one line of proof next to the buttons
- Pick a couple of items (tabs below).
- One line beside or under the buttons.
A volume or result that proves scale. MobiWire's, in the screenshot.
{Number} {what it counts}36M devices shipped in 2025 · 1,500+ in-house engineers3 to 5 customer logos your buyer knows, small and in one color.
Trusted by {logo} {logo} {logo}A rating with its source and count, for self-serve products.
{Stars} {rating} on {source} from {count} reviews★★★★★ 4.9 on G2 from 380 reviewsThe marks a regulated buyer checks first. MobiWire shows FDA, FCC and CE under its buttons.
FDA · FCC · CEWhy?Doubt is highest at the moment of commitment.
Show the real product, not an illustration
- Use a real screen or short video of the product.
- Load it eagerly, as AVIF at 2x.
Why?People judge how a page looks in 50 ms, and skip graphics that look like ads.
Problem
0/1Do they understand my situation? Name the pain before the product, in the words customers use.
Name 2 or 3 pains in your customers' words, each with a number
- Copy customers' words from calls and reviews.
- Title the section with what's broken.
- Pick 2 or 3 pains, each with a number.
Sales forecasting is still guesswork.12 hrs/weekYou're updating the same spreadsheet for the third time today.Your team copies data between 6 tools. That's 12 hours a week of work a script could do.Why?40 to 60% of B2B deals end in no decision, so show the cost of waiting.
Solution
0/1How does this fix my problem? One block per pain, the benefit first.
One feature block per pain, benefit first
- About 3 blocks, one per pain, same order.
- Title, one paragraph, a real screenshot.
- B2B: integration logos after it.
When the problem section was strong: answer it head-on.
How {product} fixes this.When the product does several jobs: frame them as one outcome.
Everything you need to {outcome}.Auto-sync: your CRM updates itself.Connect once, never copy-paste again. Teams save 12 hours a week on average.Why?Three claims persuade best; a fourth makes people skeptical.
How it works
0/1Is this going to be hard? Show the way in as a few short steps.
Show a few numbered steps, the first one free and easy
- About 3 steps, each one action.
- Make step 1 free and easy.
- Close with the time to first result.
When the steps are simple: say so.
Three steps. That's it.When speed is the selling point: put the time in the title.
From {start} to {outcome} in {timeframe}: From signup to first report in 60 seconds.1. Answer a few questions (5 min).Most teams are up and running in under 10 minutes.Why?A short numbered path makes starting feel small.
Testimonials
0/2Did it work for someone like me? Named people, with a number.
Show a few named testimonials, each with a number
- Pick customers like your buyer.
- Get a number and their full name.
- Lead with the result.
The default: a few cards side by side. Schema Flow's, in the screenshot, are verified on Trustpilot.
"{Specific result}" Name, Title, Company"We cut onboarding from 3 weeks to 2 days." Sarah Kim, VP Ops, StripeWhen you have a full story: one card that links to it.
How {Company} {result} in {timeframe}How NovaPay cut their site launch from 14 weeks to 3 days.When a customer will talk on camera: 30 to 60 seconds, captioned, the result in the first sentence.
{Name}, {Title} at {Company}: "{result}"+247% demo bookings in 90 daysWhy?A named peer with a result proves what an anonymous quote can't.
Put one proof point next to every button
- Add one line of proof under each button.
Why?Doubt is highest at the moment of the click.
Pricing
0/1Can I afford it, and is it worth it? The price on the page, the choice made easy.
Show the price, with one plan marked as recommended
- Pick how you sell (tabs below).
- Test: can someone pick a plan in 10 seconds?
2 or 3 plans side by side, the price large, one marked Most popular, only what differs listed, and a risk reversal under them. Schema Flow's, in the screenshot.
$49/seat/mo. Everything included.Pro (for growing teams)14-day free trial. No credit card required. Cancel anytime.When the price depends on the deal: skip the section on the homepage and link Pricing in the nav to a page with what it depends on and a range or starting price.
From $1,500 a month. Most teams pay $1,500 to $4,000.Larger team or custom needs? Talk to us.Why?A missing price reads as expensive; a marked plan makes choosing easy.
FAQ
0/1What's the catch? The questions sales hears, answered before the call.
Answer the real objections, yes or no first
- Collect questions from sales calls and chat.
- Answer the most-asked ones, yes or no first.
- End with a Still have a question? prompt and the button.
Can I cancel anytime? Yes. No contracts, no fees. Your data exports in one click.Is my data secure? Yes. SOC 2 compliant, encrypted at rest and in transit.Why?Every question answered on the page is one less reason to leave.
Final call to action
0/3One last push at the bottom, for everyone who read this far.
Restate the promise in new words, with the same button
- Pick a heading pattern (tabs below).
- Add a one-line risk reversal.
- Use the hero's exact button.
The plain invitation.
Ready to {outcome}?: Ready to launch your website?When the pain is sharp: name it once more.
Stop {pain}. Start {outcome}.: Stop waiting months. Start launching in days.When speed is the promise: make the future concrete.
{Timeframe} from now, you could {outcome}.: 3 days from now, your website could be live.Free trial. No credit card. Cancel anytime.Why?People who reach the bottom are interested; don't make them scroll back.
Offer a lighter step for people not ready
- Offer a guide, calculator or newsletter.
- Ask for an email only.
Why?Most visitors aren't ready to talk; a smaller ask keeps them.
Keep the form to the fields you use
- Cut every field nobody uses.
- Keep name, email and one question.
- Show the calendar right after.
Why?Unused fields cost sign-ups; dropping one you need costs lead quality.
Lighthouse: speed, accessibility, SEO
0/5Across every section, the technical side Google measures. Run Lighthouse on mobile and work down its four scores.
Pass Core Web Vitals for real users
- Check real-user data in PageSpeed Insights (the top section), not only the lab score.
- Fix LCP, then INP, then CLS.
- LCP (largest element loaded): 2.5 s or less
- INP (response to a tap or click): 200 ms or less
- CLS (layout shift): 0.1 or less
- Measured on 75% of real visits, not one test
Why?B2B sites that load in 1 second convert about 3x better than at 5.
Get Accessibility to 90+: tap targets, contrast, labels
- Fix every red item in Accessibility.
- Make buttons 44px tall, text 4.5:1 contrast.
- Honor reduced motion.
Why?Aim for 44 to 48px; under 24px fails WCAG.
Use the page with only a keyboard
- Press Tab from the top of the page to the form.
- Every link and button gets a visible focus outline.
- You can send the form without a mouse.
Why?If they can't reach the button by keyboard, they can't convert.
Get Best Practices and SEO to 100
- Fix every red item in both sections.
- Check title, description and indexing.
Why?Both are right-or-wrong lists, so 100 is realistic.
Check how far people scroll
- Open PostHog's scroll heatmap.
- Move key proof above the 50% line.
Why?74% of viewing time is in the first two screens.
Measure every change
0/3A change you can't measure is a guess. Track the result before and after, one change at a time. No tracking yet? Our free website analytics guide sets it up step by step.
Record the conversion rate before you change anything
- Track the lead as an event in Google Analytics or PostHog.
- Note visitors, leads and rate for the last 4 weeks.
Why?Without a before, you can't tell whether the change helped.
Compare equal periods, one change at a time
- Change one section.
- Compare 4 weeks after with the 4 weeks before.
- Keep it only if leads went up.
Why?Two changes at once can cancel out, and seasons skew short periods.
A/B test only with enough traffic
- Work out the sample size you need before you start.
- Run full weeks and don't stop early.
- Low traffic: test with 5 users instead.
Why?Fewer than a third of tested ideas actually improve the result.
On this page
- 01Why does a website get traffic but no leads?
- 02What happens when you fix one step?
- 03Is your conversion rate actually bad?
- 04Is the traffic real, and is it the right traffic?
- 05Do visitors understand what you do in five seconds?
- 06Do they believe it?
- 07Is the next step easy?
- 08The homepage conversion checklist
- 09Should you A/B test?
- 10What should you fix first?
- 11Questions founders ask
- 12Other free tools
Why does a website get traffic but no leads?
Because a visitor has to pass several steps before they get in touch, and at every step some of them drop off. The steps multiply, so a site can lose almost everyone without one step looking terrible. Here’s a site with 2,000 visitors a month, with the steps you can track in Google Analytics or PostHog:
| Step | Drop-off | Conversion from start |
|---|---|---|
| Visitors | 0% | 100% (2,000) |
| Clicked the main button | −90% | 10% (200) |
| Started the form | −50% | 5% (100) |
| Sent the form | −40% | 3% (60) |
| Booked a demo | −50% | 1.5% (30) |
| Booked demos | 2,000 × 10% × 50% × 60% × 50% = 30 | |
| Step | Drop-off | Conversion from start |
|---|---|---|
| Visitors | 0% | 100% (2,000) |
| Clicked Start free | −88% | 12% (240) |
| Created an account | −40% | 7.2% (144) |
| Reached the first result | −60% | 2.9% (58) |
| Paid after the trial | −80% | 0.6% (12) |
| Paying customers | 2,000 × 12% × 60% × 40% × 20% = 12 | |
| Step | Drop-off | Conversion from start |
|---|---|---|
| Visitors | 0% | 100% (2,000) |
| Opened a case study | −70% | 30% (600) |
| Clicked Contact | −80% | 6% (120) |
| Sent the form | −60% | 2.4% (48) |
| Enquiries | 2,000 × 30% × 20% × 40% = 48 | |
Each drop has a usual reason. Few clicks on the main button means the page didn’t say what you do or why to trust you. People who start the form and quit hit too many fields or a reason to doubt. Booked calls that never happen mean the next step felt like a commitment.
So there are two ways to get more leads from the same traffic: fewer steps, and fewer people dropping off at each one. Cut a step that isn’t needed, like a separate contact page when the form could sit on the case study, and nobody can drop off there. Then fix the step with the biggest drop-off.
What happens when you fix one step?
It depends which. In the B2B example, make a strong step better, sending the form from 60% to 70%, and you get 35 booked demos instead of 30. Fix the weakest, the main button from 10% to 20% of visitors, and you get 60. Same traffic, twice the demos, from one change.
That’s why a full redesign often changes nothing: the one broken step is still broken. The job is to find it.
Is your conversion rate actually bad?
Maybe not. It depends on which pages you count:
| What you measure | Typical rate |
|---|---|
| Whole site, B2B SaaS, every visitor counted | about 1% to 2.5% |
| Campaign landing pages, SaaS median | 3.8% (Unbounce, 41,000+ pages) |
| Pricing and demo pages | well above the site average |
A site at 0.8% overall may be fine if most traffic reads the blog. Measure the demo and pricing pages on their own, and compare against your own last quarter first.
Is the traffic real, and is it the right traffic?
Check this before touching a page. Bots and AI crawlers inflate visitor counts, and how-to readers came to learn, not to buy. Look at leads by source and by landing page. If most visits land on blog posts, the homepage isn’t your problem.
Do visitors understand what you do in five seconds?
Show a stranger your first screen for five seconds, then ask what you sell and for whom. “The future of data” fails that test. “Sync Salesforce and HubSpot in real time, without code” passes. Then show the product itself: a screenshot, a short video or a clickable tour beats any illustration.
Do they believe it?
Tech buyers check three things before they talk to anyone:
- Proof: a customer they recognize and a result with a number, near the button.
- Fit: the integrations they use, and whether it works with their stack.
- Risk: a security page or SOC 2 status, and a price signal, even “from $X a month”.
Most buyers have a favorite before they ever contact a vendor, so this proof has to be on the site, not in the sales call.
Is the next step easy?
Ask for three form fields, not nine. Show a calendar right after the form, so people book on the spot. For visitors not ready to talk, offer a lighter step: a free trial if the product is self-serve, a recorded demo if it’s sales-led. And reply within minutes; at a founder-led startup that often means the founder’s own inbox.
The homepage conversion checklist
- A headline that names the result for a specific buyer
- One line under it that says what the product is
- A product screenshot or short video above the fold
- A customer they recognize, with a number, next to the button
- Integrations, security and a price signal visible
- One main button, a three-field form, a calendar right after it
- A lighter step for visitors not ready to talk
- The form tracked as a goal, by traffic source
Should you A/B test?
Usually not yet. At a 3% rate, spotting a 20% improvement takes about 13,000 visitors for each version. With less traffic, make one bold change, watch five people use the page, and compare the weeks before and after.
What should you fix first?
The weakest step, and nothing else until it’s fixed. Every new visitor you buy meets the same leak.
Questions founders ask
01Why is my website getting traffic but no leads?
Because one link between the visit and the request breaks: the wrong people arrive, they don't get what you do in seconds, they don't believe it, or the next step asks too much. The links multiply, so the weakest one sets your result. On B2B sites two are easy to miss: proof (nothing near the button shows it worked for someone like them) and fit (most traffic reads how-to posts and came to learn, not to buy).
02What is a good conversion rate for a B2B website?
It depends on which pages you count. Whole-site visitor-to-lead rates for B2B SaaS sit around 1% to 2.5%, because every blog reader is counted. Campaign landing pages do better: the median SaaS landing page converts 3.8% in Unbounce's benchmark of 41,000+ pages. Measure your demo and pricing pages on their own, compare against your own last quarter first, and count only sent forms and booked calls as leads.
03How do I calculate my website conversion rate?
Divide leads by visitors over the same period and multiply by 100: 20 leads from 5,000 visitors a month is 0.4%. Count a sent form or a booked call as a lead, not a newsletter signup, and use visitors, not page views. With few leads, read it with care: at 5,000 visitors, one lead more or less moves the rate by 0.02 points.
04What should a B2B conversion checklist include?
One check per link a visitor has to pass. Fit: where the traffic comes from. Clarity: a headline that names the result for a specific buyer, and the main content on screen within 2.5 seconds on a phone. Proof: a case study with a number, named quotes, reviews, your security status and a price signal near the button. Ease: one main button, three form fields, a fast reply and a smaller step. Then tracking of the main goal. Fix the weakest link first instead of working down the list.
05How do I get more leads from my website without more traffic?
Fix the weakest link before you buy traffic, because every new visitor meets the same leak. Run a five-second test on the first screen, put proof with a number next to the main button, cut the form to three fields and reply within minutes. In the Lead Response Management study, the odds of qualifying a lead were 21 times lower at 30 minutes than at 5.
06Why is my bounce rate so high?
Usually because the page doesn't match why people came: a how-to reader landing on a sales page, an ad promising something the headline doesn't say, or a page that loads slowly on a phone. GA4 now reports engagement rate instead, the share of visits that stay 10 seconds, view two pages or convert. Low engagement on blog posts is normal; on your homepage and pricing page it points at fit or clarity.
07Should I A/B test with low traffic?
Usually not. At 3% conversion, detecting a 20% lift at 95% significance and 80% power takes about 13,000 visitors per version, and at 0.4% about 100,000. Below that, make bold changes, watch five people use the page (five users find about 85% of usability problems, in Nielsen's model) and compare the weeks before and after.
08What should a SaaS homepage include?
A headline that names the result for a specific buyer, a line under it that says what the product is, one main button, proof near that button (logos, a case study with a number, named quotes), a price signal, and a smaller step such as a guide or a recorded demo for visitors who aren't ready to talk.
Sources (14)
- Unbounce: SaaS landing page conversion rateThe median SaaS landing page converts 3.8%
- Unbounce: Conversion Benchmark Report 202441,000+ landing pages, a median of 6.6% across industries
- Ruler Analytics: Average conversion rate by industryMay 2026, 110M+ sessions: software 7.6%, professional services 6.1%
- Nature: Users judge websites in 50 milliseconds (Lindgaard et al.)A first impression forms in 50 milliseconds and colors the rest of the visit, so the first screen has to land at a glance
- web.dev: Web VitalsGood Largest Contentful Paint is 2.5 seconds or less at the 75th percentile
- Portent: Site speed is (still) impacting your conversion rate2022, 20 sites: B2B pages at 1 second convert about 3x those at 5 seconds
- 6sense: Buyer Experience Report 2025Vendor-run survey of about 4,000 buyers: first contact at 61% of the journey, the favorite wins 80%
- Clutch survey via Agility PR: Trust issues in the B2B sales funnel2020, 451 B2B buyers: transparent pricing 25%, case studies and testimonials 23%
- Lead Response Management study2007, six companies: qualifying odds 21x lower at 30 minutes than at 5
- Nielsen Norman Group: Why you only need to test with 5 usersFive users find about 85% of usability problems
- Evan Miller: Sample Size CalculatorThe two-proportion formula behind the A/B test numbers
- Contentsquare: Conversion rate optimization guideThe CRO process for teams with traffic: identify, analyze, gather data, hypothesize, test, iterate
- WiderFunnel: The LIFT modelThe lineage of the links: value, relevance, clarity, anxiety, distraction, urgency
- Wikipedia: Conversion rate optimizationThe definition and the conversion rate formula
Social proof
0/6Straight under the hero, before any feature: can I trust these people? Each kind of proof answers a different doubt, so use the ones your buyer has.
LabelOpen the section with one line and a number
{Number} + {who trusts you}Trusted by 2,400+ teams including Stripe, Notion and Linear.Why?A line on top says what the proof adds up to.
NumbersShow a few numbers that prove the promise
How much you've done: customers, units, countries.
36M devices shipped · 47 countries · 2,400 teamsHow well you do it: failure rate, uptime, on-time delivery. MobiWire's cards in the screenshot.
<1% device failure · >96% on-time delivery · 99.9% uptimeWhat customers got: time or money saved, growth.
12 hours a week saved · 3x more demos · 40% lower costHow long and how deep: years, team size, projects.
8 years in market · 1,500+ engineers · 300 launches{Big number} + {what it measures}Why?Specific numbers read as fact; round claims read as marketing.
LogosShow a handful of logos your buyer recognizes
Who pays you. The strongest kind: companies like the visitor's. MobiWire's Select customers row.
Select customers · 5 to 10 year partnershipsWho you build with: technology, platforms, resellers. Proves you're part of the ecosystem. MobiWire's Key tech partners row.
Key tech partners: MediaTek, Qualcomm, Unisoc, AndroidWhat your product connects to. Answers "will it work with our stack?" for software.
Works with Salesforce, HubSpot, SlackWho backs you. Matters to enterprise buyers worried you'll disappear.
Backed by Y Combinator and Index VenturesWho wrote about you. For young companies and personal brands without big customers yet.
As seen in TechCrunch, Forbes, The VergeWhy?A logo they know borrows its trust; an unknown one adds nothing.
CertificationsShow the certifications your buyer's procurement asks for
Manufacturing and process standards. MobiWire's ISO and IATF row.
ISO 9001 · ISO 13485 · IATF 16949For software holding customer data.
SOC 2 Type II · ISO 27001 · GDPR · HIPAAThe marks a product needs to be sold in a market.
FDA · FCC · CE · PCI DSSFor buyers with ESG requirements.
EcoVadis Gold · B Corp · ISO 14001Why?A missing certificate can end a deal before the first call.
StarsShow your rating with its source and count
Where B2B software is compared.
★★★★★ 4.9 on G2 from 380 reviewsCapterra · TrustRadius · Product HuntWhere agencies and service firms are compared.
★★★★★ 5.0 on Clutch from 42 reviewsWhere everyone else is reviewed. Schema Flow verifies its testimonials here.
★★★★★ 4.8 on Trustpilot from 200+ reviewsGoogle reviews{Rating} on {source} from {count} reviewsWhy?A rating with its source and count can be checked; bare stars can't.
TrustShow there are real people behind the site
Why?People check that a company is real before they trust it.